June 30th NASS Report: Unexpectedly Quiet
The National Agricultural Statistics Service (NASS) released their latest crop data for US grains on June 30, 2025. This data was surprisingly uneventful. There had been quite a bit of speculation around potential shifts in planting patterns. 1 As it turns out, there were no unexpected adjustments across major commodity categories.
Corn Posts Predictable Gains
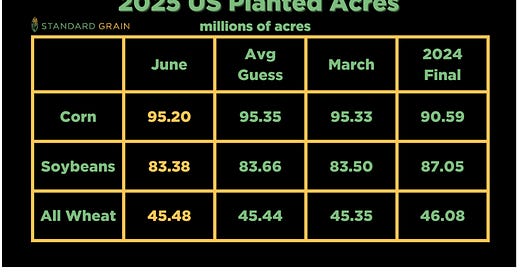
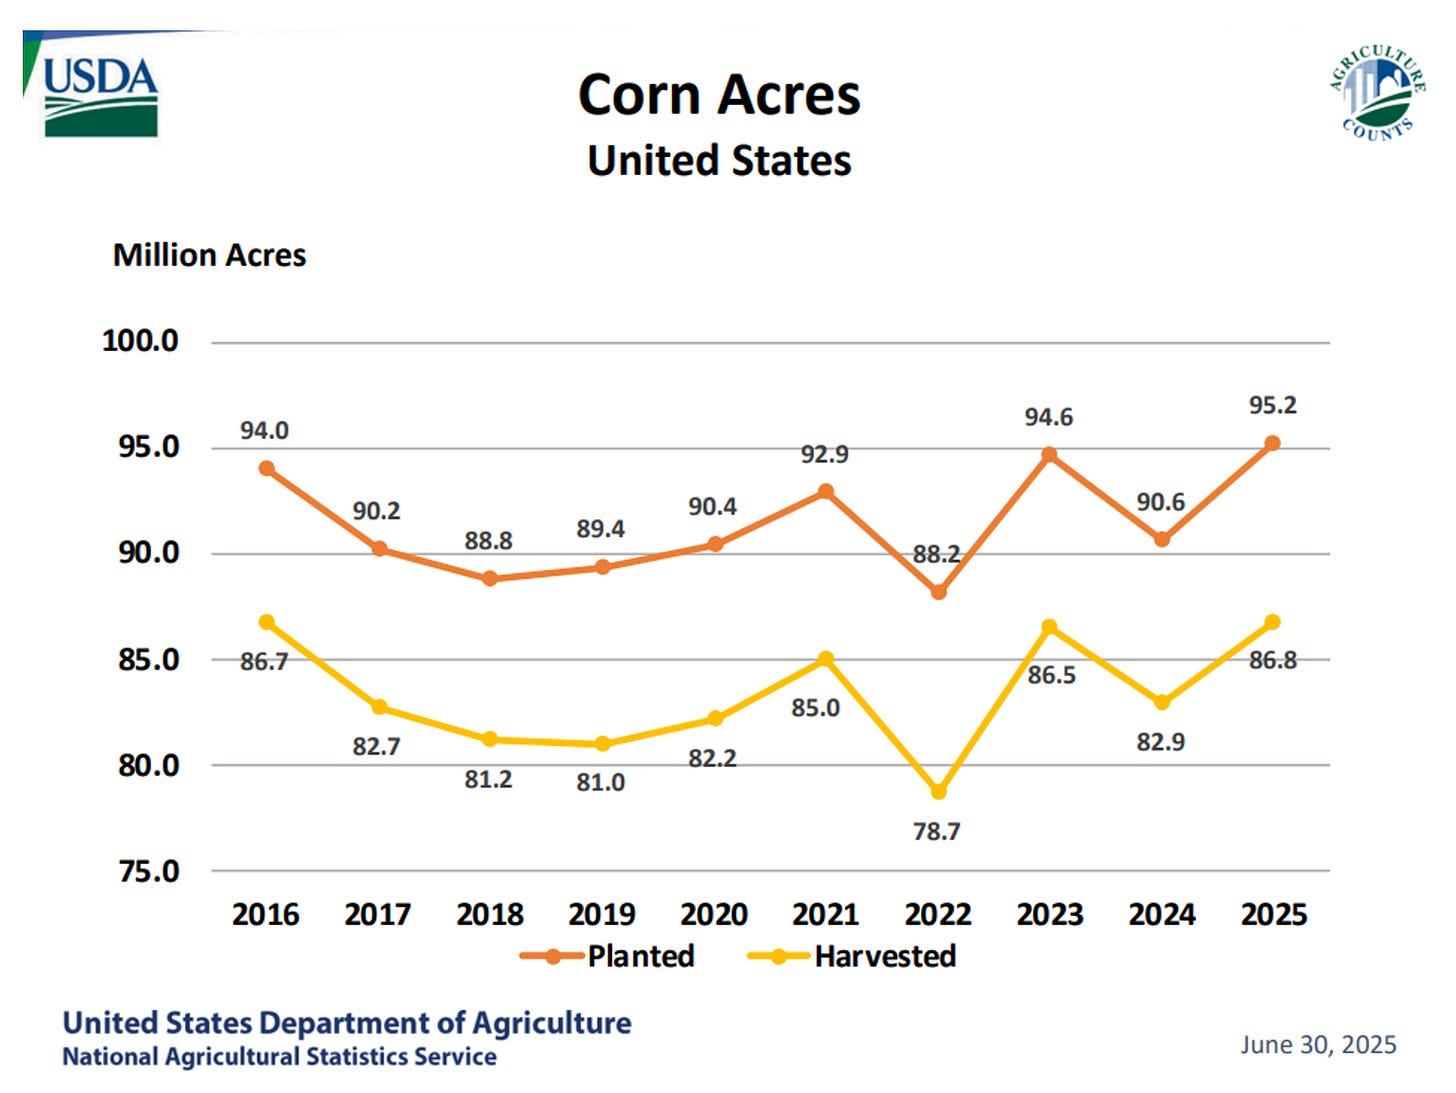
Updates to the 2025 data shows that farmers planted 95.2 million acres of corn this year. This is up 5 percent from 2024. This revision added 4.61 million acres to the previously reported planting numbers. The 5% reported growth isn’t from a single area either. 41 of the 48 states surveyed reported an increase or no change in plantings compared to this time last year.
The projected area harvested now stands at 86.8 million acres, matching the 5 percent growth rate seen in total plantings. This pairing is a positive prospect for both farmers and markets, it shows that both remain confident in the market’s strength and the weather conditions for the remainder of the growth cycle.
Corn storage data is a straight-forward story. Steady demand is eating into the supply. Total inventories dropped 7 percent to 4.64 billion bushels compared to last June. The decline happened primarily on farms, where grain storage fell 16 percent to 2.56 billion bushels. Commercial elevators and warehouses increased their holdings by 6 percent to 2.09 billion bushels. Corn consumption rose slightly to 3.50 billion bushels. That’s up from 3.36 billion bushels during the same period last year. This pattern of declining farm stocks and rising consumption is a normal seasonal trend.
Soybeans
Soybean production delivered no surprises. Data shows that the planted soy acreage dropped 4 percent to 83.4 million acres. This reduction affects 25 of the 29 states reporting.
Despite the reduced acreage, soybean storage levels climbed 4 percent to reach 1.01 billion bushels by June 1. This development stems from off-farm storage gains of 18 percent for 596 million bushels. This offsets the 12 percent decline in on-farm holdings to 412 million bushels. Consumption from March-May disappearance rose 3 percent to 903 million bushels.
Wheat Markets Display Stability
All wheat categories experienced changes but they were well within where analysts had pegged them.2 Planted acreage fell 1 percent to 45.5 million acres. Winter wheat, comprising the largest segment at 33.3 million acres, remained almost perfectly stable with less than 1 percent reduction from 2024. Hard Red Winter wheat accounts for 23.6 million acres of this total, followed by 6.10 million acres of Soft Red Winter and 3.67 million acres of White Winter varieties.
Spring wheat faced slightly steeper reductions declining 5 percent to 10.0 million acres. Hard Red Spring wheat represents 9.44 million acres of this category. Durum wheat provided the quarter's most exciting development with a 2 percent increase in planting to 2.11 million acres.
Wheat storage levels rose 22 percent to 851 million bushels. On-farm stocks increased 32 percent to 184 million bushels, and off-farm storage rose 20 percent to 667 million bushels. March-May disappearance declined 2 percent to 386 million bushels. This indicates a demand softening that regularly occurs in commodity cycles.
Cotton Provides the Quarter's Only Notable Movement
Cotton experienced a similarly subdued report, with total planted area falling 10 percent to 10.1 million acres. Upland cotton, which represents the majority of production, dropped 9 percent to 9.95 million acres. American Pima varieties faced a steep reduction of 17 percent. That led to an overall decline to 171,000 acres. While this drop is an outlier it still represents a fairly routine market adjustment rather than indicating a crisis.
These reports show that market is moving almost directly in line with analyst expectations.2 Farmers have made small adjustments based on market signals and seasonal conditions, but nothing drastic. The data contains minimal surprises for commodity markets, no dramatic policy implications, and no cause for alarm. In an industry often subject to weather disasters and market volatility, consistency is worth celebrating.
Source:
U.S. Department of Agriculture, National Agricultural Statistics Service, "Acreage," June 2025, https://downloads.usda.library.cornell.edu/usda-esmis/files/j098zb09z/4455bc157/4x51kh779/acrg0625.txt.
U.S. Department of Agriculture, National Agricultural Statistics Service, "Grain Stocks," June 2025, https://downloads.usda.library.cornell.edu/usda-esmis/files/xg94hp534/668302938/g445fc26h/grst0625.txt.
1 Karen Braun, "Five Charts to Consider Ahead of the 2025-26 US Crop Season," Reuters, March 3, 2025, https://www.reuters.com/markets/us/five-charts-consider-ahead-2025-26-us-crop-season-braun-2025-03-02/.
2 Naomi Blohm, quoted in "USDA Updates 2025 Acreage Estimates in Latest Report," Agriculture.com, June 30, 2025, https://www.agriculture.com/usda-acreage-quarterly-grain-stocks-june-30-2025-11763012.
The information provided on this page and its associated documents is intended to provide a broad overview for discussion purposes. It is subject to change and should not be taken as financial or investment advice. Teucrium Trading LLC and Teucrium Investment Advisors, LLC make no offers to sell, solicitations to buy, or recommendations for any security, nor do they offer advisory services.
Past performance is not indicative of future results. Teucrium disclaims any liability for any actions taken based on the information provided herein.


