

May WASDE Analysis
Initial Takeaways

May’s WASDE is an important one as it is provides the first look at official new crop projections.
The USDA’s first 2026/27 forecasts came in below trade expectations across most lines, with wheat carrying the headline. We’ve been calling this Golden Grain Cycle Stage #1, where prices chop sideways around cost-of-production. This report provides some underlying fundamentals that may end up supporting a recharacterization to stage #2.
Production cuts, smaller new-crop carryouts, and a global corn stocks figure at the lowest level since 2013/14 all argue for a re-rating.
Weather over the next six to eight weeks across the HRW belt and the corn and soy growing regions is the next gating factor. Geopolitics matter too, with the Trump-Xi meeting on May 14 and EPA’s Renewable Volume Obligations for 2026 and 2027 pulling soybean crush sharply higher.
CORN
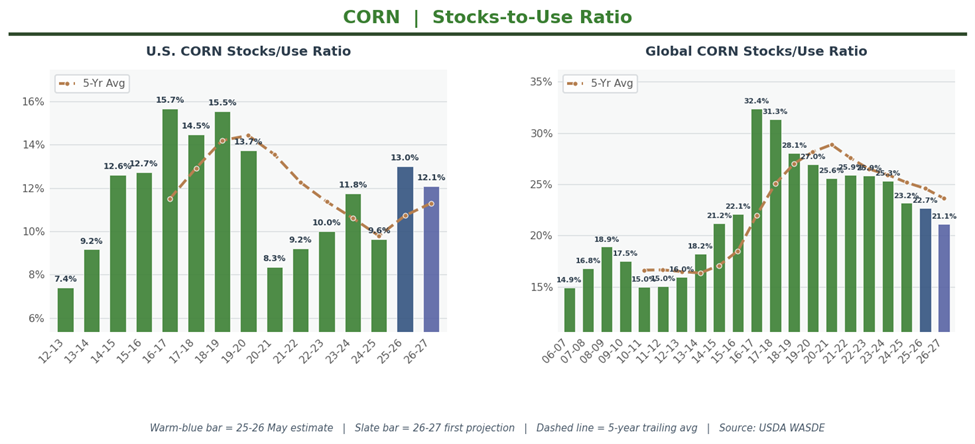
USDA raised 2025/26 U.S. corn carryout 15 million bushels to 2,142 million, 12 above the 2,130-million analyst average. Production held at 17,021 million bushels. Feed and residual stayed at 6.2 billion. The 2025/26 season-average price forecast held at $4.15 per bushel. 2025/26 stocks-to-use sits at 13.0%, snug but still inside the 10 to 15% adequate-with-pressure zone.
The headline is the new crop. USDA’s first 2026/27 corn projection landed at 1,957 million bushels of ending stocks, 15 million above the 1,942-million analyst consensus and 185 million below 2025/26. Production at 15,995 million bushels on a 183.0 bushel-per-acre yield, both squarely in line. Planted area dropped 3.5 million to 95.3 million. The 2026/27 season-average price forecast moves up 25 cents to $4.40 per bushel. U.S. 2026/27 stocks-to-use steps down to 12.1%.
The global picture is the bigger story. 2025/26 world corn stocks moved up to 296.95 million metric tons, 2 mmt above April. World 2025/26 stocks-to-use at 22.7% is comfortable.
However, the 2026/27 number is meaningfully tighter: 277.54 mmt, 13.7 below the 291.2-mmt analyst average and the lowest figure since 2013/14. World 2026/27 stocks-to-use slides to 21.1%, on the snug end of comfortable.
Argentina, Ukraine, Mexico, and South Africa all are projected to produce smaller crops year-over-year. China and Brazil pick up some slack but not enough to offset the major-exporter tightening.
SOYBEANS
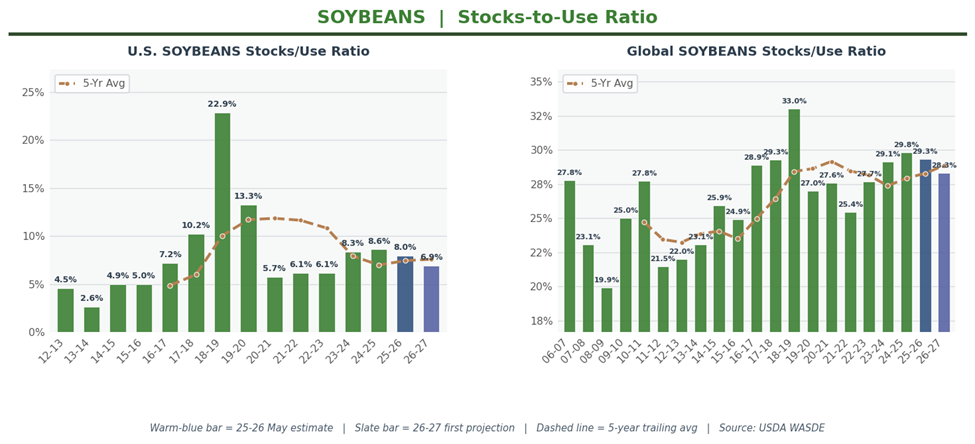
The USDA tightened 2025/26 U.S. soybean carryout 10 million bushels to 340 million, 9 below the 349-million analyst average. Crush moved up 20 million to 2,630 million bushels on stronger biofuel demand; exports held at 1,530 million. The 2025/26 season-average price forecast for soybeans nudged up 10 cents to $10.40 per bushel, oil climbed to 63 cents per pound, and meal moved to $315 per short ton. U.S. 2025/26 stocks-to-use at 8.0% remains below the ’24-’25 crop year.
The 2026/27 projection came in tighter than the trade expected. USDA pegged new-crop ending stocks at 310 million bushels, 56 million below the 366-million analyst average, on a 4,435-million-bushel crop that was basically in line with consensus.
The story is on the demand side. Crush jumps 120 million bushels to 2,750 million as EPA’s RVOs lift soybean oil for biofuel to 17.8 billion pounds, up 3.6 billion from 2025/26. Exports rise to 1,630 million as the tariff drag from 2025/26 eases. The 2026/27 season-average price forecast for soybeans moves up $1.00 to $11.40 per bushel; oil climbs 7 cents to 70 cents per pound; meal eases $5 to $310 per short ton. U.S. 2026/27 stocks-to-use is projected to step down to 6.9%, which if realized would mark the 2nd consecutive year of a tighter domestic balance sheet.
Globally, 2025/26 soybean stocks landed at 125.13 mmt, basically flat to April. World 2025/26 stocks-to-use at 29.3% reads adequate but just below the burdensome threshold. The 2026/27 number at 124.78 mmt is roughly in line with the 126.5 analyst average. World 2026/27 stocks-to-use eases to 28.3%. Brazil and Argentina are both expected to grow more in 2026/27 (186.0 and 50.0 mmt respectively), but strong demand is projected to help keep supplies in check. Notably the global balance sheet appears poised to tighten for the second consecutive year as well.
WHEAT
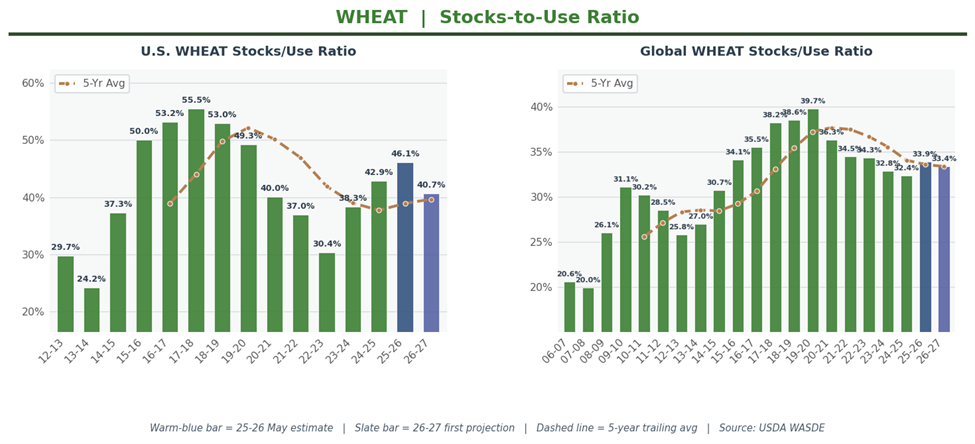
The USDA trimmed 2025/26 U.S. wheat carryout 3 million bushels to 935 million, 5 above the 930-million analyst average. Production held at 1,985 million bushels. The 2025/26 season-average price forecast held at $5.00 per bushel. 2025/26 stocks-to-use at 46.1% is still unambiguously burdensome.
However, the new crop balance sheet is telling a completely different story.
The USDA’s first 2026/27 wheat production forecast came in at 1,561 million bushels, 186 million below the 1,747-million analyst average and 424 million under 2025/26. Winter wheat dropped to 1,048 million bushels, 164 million below survey and down 25% year-over-year, with Hard Red Winter the primary driver. Yield was projected at 47.5 bushels per acre, 5.8 below last year’s record. New-crop ending stocks came in at 762 million bushels, 83 million below the 845-million analyst average and down 18% from 2025/26. The 2026/27 season-average price forecast jumped $1.50 to $6.50 per bushel, a 30% bump. U.S. 2026/27 stocks-to-use steps down to 40.7%, still comfortable, but a meaningful tightening year-over-year.
Globally, 2025/26 wheat stocks landed at 279.21 mmt, 4 mmt below April. World 2025/26 stocks-to-use at 33.9% sits at the high end of comfortable. The 2026/27 projection at 275.04 mmt is 5.7 below the 280.7-mmt analyst average, with every major exporter (United States, EU, Argentina, Australia) expted to produce a smaller crop. World 2026/27 stocks-to-use steps to 33.4%, is also tightening but still comfortable by historical standards.
In summary, the domestic and global balance sheets for all three crops are expected to tighten this year. Lower supplies in the face of resilient demand create fundamental price support. Traders are likely to continue keying in on weather and war.
We believe we’re still in Stage #1 of the Golden Grain Cycle, but we might not be for long.
Time will tell.